
There are many types of Electronic and Electrical Equipment (EEE) put on the Market (POM), necessitating sensible and practical categorization. Various classifications can describe e-waste, each potentially valuable for forming a measurement framework. However, classifications must comply with specific criteria to effectively harmonize e-waste measurement and produce internationally comparable indicators.
A classification system for e-waste statistics should categorize products based on the following criteria:
Functionality: Products should be grouped by similar functions.
Material Composition: Categories should consider comparable material composition, focusing on hazardous substances and valuable materials.
End-of-Life Attributes: Related end-of-life characteristics should be included.
Additionally, products within the same category should exhibit:
A homogeneous average weight
A consistent lifetime
This uniformity simplifies quantitative assessments for similar products.
Furthermore, large or environmentally relevant e-waste products for which substantial data is available should be assigned to separate categories.
Currently, the only classification system that fulfills these criteria is the UNU-Keys. The following table shows UNU-Keys categories, average weight, and lifetime for POM in Egypt.
Table 7: UNU-KEYS of WEEE-Equipment and Average Weight
UNU-KEY | Description | Average weight -2018 (kg/piece)[2] | Average lifetime (years) |
302 | Desktop PCs | 8.77 | 6 |
303 | Laptops | 1.26 | 6 |
307 | Professional IT equipment (e.g., servers, routers, data storage, copiers) | 40 | 5 |
301 | Small IT equipment (e.g., routers, mice, keyboards, external drives & accessories) | 0.4 | 5 |
305 | Telecommunication equipment (e.g., cordless phones, answering machines) | 0.45 | 5 |
306 | Mobile phones (including smartphones, pagers) | 0.09 | 4 |
407 | Cathode Ray tube TVs | 33.2 | 8 |
309 | Flat display panel TVs | 5.5 | 8 |
308 | Cathode Ray Tube Monitors | 22 | 8 |
309 | Flat display panel monitors (LCD, LED) | 5.5 | 8 |
304 | Printers (e.g., scanners, multi-functionals, faxes) | 10.3 | 5 |
403 | Music instruments, radio, Hi-Fi (including audio sets) | 3.73 | 8 |
404 | Video (e.g., Video recorders, DVD, Blue Ray, set-top boxes) and projectors | 3.51 | 8 |
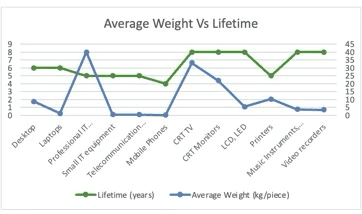
Figure 3: Average Weight of Electronic Equipment and its Expected Lifetime
Table 8: POM Quantities (# of units) in Egypt (2014-2023)
Equipment | UNU-KEYS | POM Quantities in Piece | |||||||||
2014 | 2015 | 2016 | 2017 | 2018 | 2019 | 2020 | 2021 | 2022 | 2023 | ||
Radio | 403 | 237926 | 58260 | 91386 | 141104 | 120018 | 49313.5 | 7339 | 911 | 411 | 0 |
CRT Monitors | 308 | 491911 | 373988 | 672294 | 780570 | 469967 | 425777 | 363906 | 313256 | 358458 | 279541 |
CRT TV | 407 | 87825 | 550525 | 445050 | 3049698 | 2471212 | 2707000 | 1582000 | 2472895 | 2630697 | 2800143 |
Flat Panels * | 309 | 28150 | 25925 | 143349 | 421734 | 3520126 | 1352224 | 560828 | 824824 | 209487 | 162779 |
Laptop | 303 | 429490 | 252108 | 281361 | 265275 | 762298 | 989061 | 814656 | 607310 | 609371 | 312161 |
Desktop | 302 | 441469 | 476786 | 388931 | 324738 | 419276 | 1430512 | 800114 | 917839 | 1464547 | 549398 |
iPad | 306 | 180931 | 300055 | 150919 | 191401 | 500194 | 623773 | 953185 | 406924 | 284146 | 77160 |
Mobile Phones | 306 | 5152995 | 4221152 | 2787408 | 7176172 | 45199106 | 19447537 | 18172719 | 12850879 | 6404996 | 1305581 |
Projectors | 404 | 29626 | 20973 | 21389 | 42581 | 44002 | 31457 | 14675 | 32856 | 5603 | 60012 |
Telecom | 305 | 1795126 | 1747224 | 1096621 | 2036981 | 3310400 | 323031 | 72058 | 515135 | 39095 | 112382 |
Printers | 304 | 582780 | 1503167 | 1833988 | 1130367 | 1592953 | 1078658 | 872430 | 862539 | 715779 | 246668 |
Alarm Devices | 301 | 535702 | 1654747 | 2743021 | 16081731 | 4527214 | 8442661 | 2978232 | 5544215 | 5212364 | 3313680 |
Mobile Network Stations | 307 | 37013 | 20669 | 14930 | 95843 | 91068 | 15233 | 31496 | 27170 | 15611 | 4221 |
* As per CAPMAS, flat panel covers both TVs and Monitors
Table 9: E-Waste Generated (in kg) in Egypt (2024-2027)
Equipment | UNU-KEYS | Generated Waste | ||||
2024 | 2025 | 2026 | 2027 | |||
Radio | 403 | Piece | 91386 | 141104 | 120018 | 49313.5 |
Kg | 340869.78 | 526317.9 | 447667.1 | 183939.36 | ||
CRT Monitors | 308 | Piece | 672294 | 780570 | 469967 | 425777 |
Kg | 14790468 | 17172540 | 10339274 | 9367094 | ||
CRT TV | 407 | Piece | 445050 | 3049698 | 2471212 | 2707000 |
Kg | 14775660 | 14787240 | 82044238 | 89872400 | ||
Flat Panels | 309 | Piece | 143349 | 421734 | 3520126 | 1352224 |
Kg | 788419.5 | 2319537 | 19360693 | 7437232 | ||
Laptop | 303 | Piece | 762298 | 989061 | 814656 | 607310 |
Kg | 960495.48 | 1246217 | 1026467 | 765210.6 | ||
Desktop | 302 | Piece | 419276 | 1430512 | 800114 | 917839 |
Kg | 3677050.52 | 12545590 | 7017000 | 8049448 | ||
iPad | 306 | Piece | 953185 | 406924 | 284146 | 77160 |
Kg | 85786.65 | 36623.16 | 25573.14 | 6944.4 | ||
Mobile Phones | 306 | Piece | 18172719 | 12850879 | 6404996 | 1305581 |
Kg | 1635544.71 | 1156579 | 576449.6 | 117502.29 | ||
Projectors | 404 | Piece | 21389 | 42581 | 44002 | 31457 |
Kg | 75075.39 | 149459.3 | 154447 | 110414.07 | ||
Telecom | 305 | Piece | 323031 | 72058 | 515135 | 39095 |
Kg | 145363.95 | 32426.1 | 231810.8 | 17592.75 | ||
Printers | 304 | Piece | 1078658 | 872430 | 862539 | 715779 |
Kg | 11110177.4 | 8986029 | 8884152 | 7372523.7 | ||
Alarm Devices | 301 | Piece | 8442661 | 2978232 | 5544215 | 5212364 |
Kg | 3377064.4 | 1191293 | 2217686 | 2084945.6 | ||
Mobile Network Stations | 307 | Piece | 15233 | 31496 | 27170 | 15611 |
Kg | 609320 | 1259840 | 1086800 | 624440 | ||
Total Quantity | Ton | 52371.2958 | 147872.4 | 133412.3 | 126009.69 | |
Source:
[2] The Global Impact of E-Waste: Addressing the Challenge, 2012.