
E-waste data and statistics matter because they provide critical insights into the environmental, economic, and social impacts of discarded electronic devices. Accurate statistics reveal the magnitude of the growth in e-waste and help policymakers and organizations recognize the urgency of addressing it. They show how much critical materials and other valuable resources are lost when e-waste is not properly recycled, illustrate the risks hazardous materials pose to ecosystems and human health, and over time help track the effectiveness of e-waste management laws.
In 2022, Egypt generated approximately 690 kilotons (kt) of e-waste in total and over 10 kg per capita, placing it first in Africa [10]. The section below provides an outlook for 2024-2027, providing also more granular e-waste data for different categories of EEE.
4.1 Methodology
For the purposes of quantifying e-waste amounts in Egypt, the UNU-KEYS classification of EEE products is adopted. The classification groups EEE products put on the market (POM) based on their similar functionality, material composition, end-of-life differences, average lifetime, and weight. Furthermore, large or environmentally relevant e-waste products for which substantial data is available are assigned to separate categories.
The amount of e-waste generated (in kg) is determined using a standard approach based on time-series data on electrical and electronic equipment introduced to the market over the years, along with the average lifetime in years for each type of EEE.
Data on EEE POM data in Egypt has been sourced from Egypt’s official government statistics from the Central Agency for Public Mobilization and Statistics (CAPMAS) for the period 2014-2021 with a focus on category 1 (ICT equipment) and category 2 (screens and monitors, see chapter 1.1). The POM accounts for the total weight of EEE available on the market by summing domestic production and imports but subtracting exports. Expected quantities between 2021 to 2023 have been extrapolated based on historical yearly growth rates.
Data from the Egyptian Industrial Development Authority and cross-checks with manufacturers and recyclers have also been used.
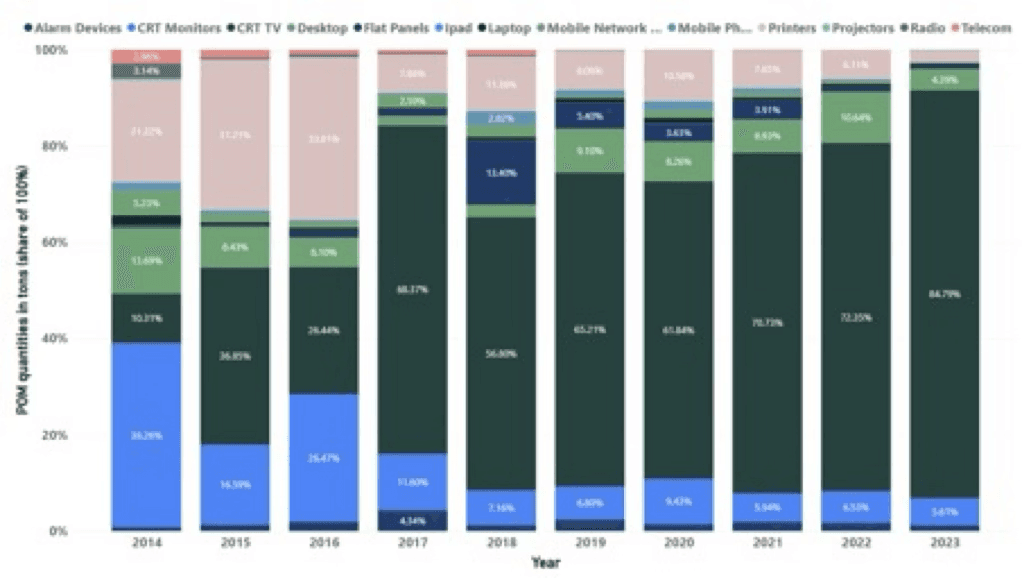
4.2 EEE POM in Egypt (in tons, 2014-2023)
Figure 1. Put-on Market EEE in Egypt for the period 2014-2023 (Source: CAPMAS)
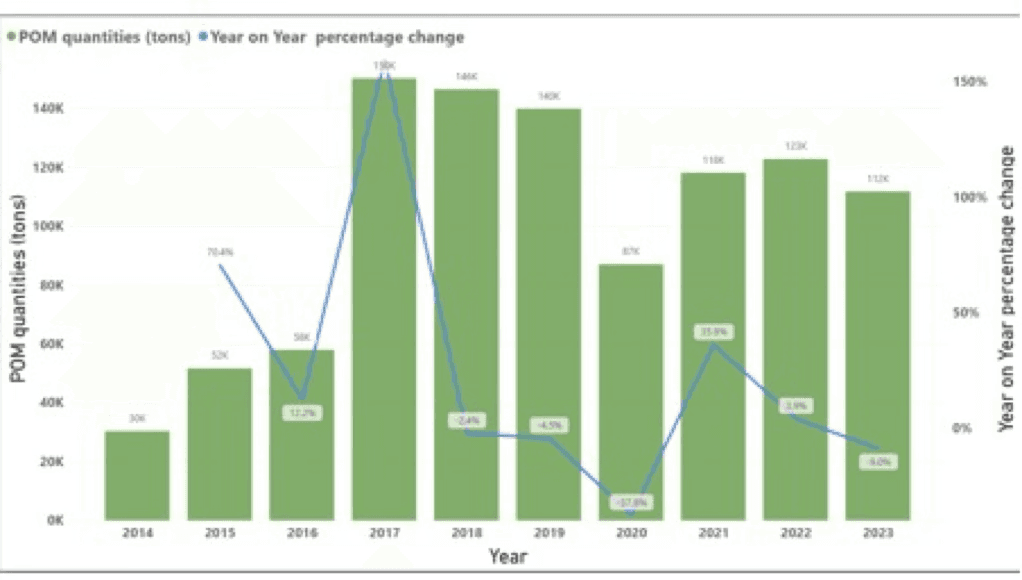
Figure 2. Breakdown of Put-on Market EEE in Egypt for the period 2014-2023 (Source: CAPMAS)
4.3 E-Waste Generated in Egypt – Historical and Forecast Quantities (in tons, 2021-2027).
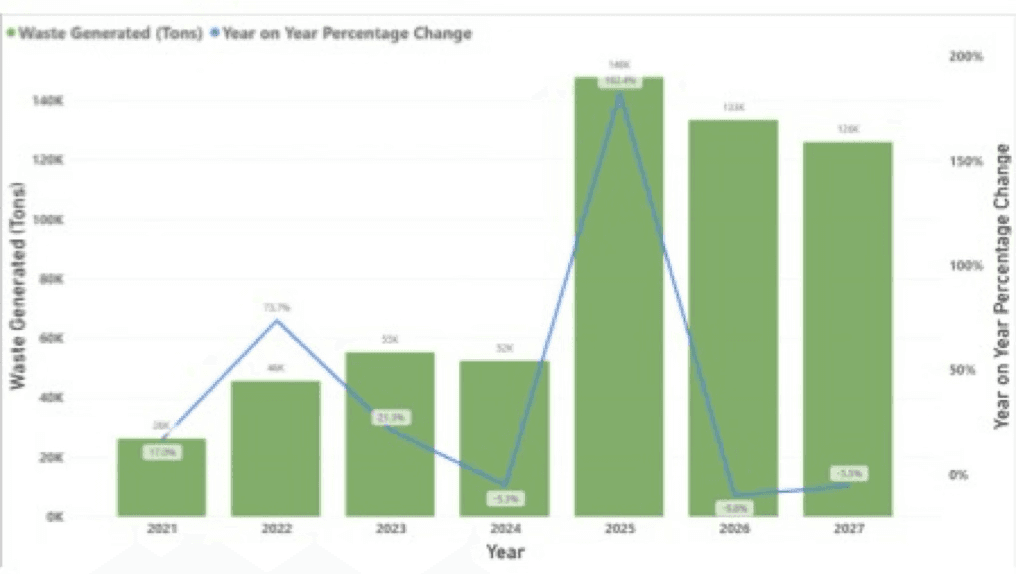
Figure 2: E-waste Generated in Egypt – Historical (2021-2023) and forecast (2024-2027) amounts
Historical quantities are based on historical POM and forecasted quantitites are based on forecasted amounts of EEE POM for 2024-2027.
4.4 Discussion
According to Figure 1, the POM data for categories 1 and 2 is subject to strong fluctuations, with an upward trend when comparing the data from 2023 with that from 2014. The peak in 2017 translates to a peak in e-waste generated in 2025, since it is assumed that CRT TVs and Monitors, both devices with a high average weight, high POM quantities, have an average lifetime of 8 years. The e-waste generated in 2022, according to CAPMAS data, amounts to 46 kt for categories 1 and 2, and in 2025, to 148 kt.
The increasing share of CRT TVs in the POM data is questionable since CRT technology has largely been replaced by flat-panel technology in recent years. This exemplifies the importance of complete and consistent data sets for adequately monitoring and forecasting mass and material flows connected to EEE and WEEE.
Source: